When we look at our medical reports, we scan for just three parameters – high, low, or normal. We equate ‘normal’ with ‘healthy’ – assuming no issues if the values fall within range.
Yet, even when results are ‘normal’, biomarkers can start drifting out of range. A hint your routine check up reports were giving, and yet you failed to notice it? Probably.
This stems from a flawed assumption: that the normal range equals good health. It’s not enough to fall within that range – you want to be in the optimal one.
Here’s why: Normal ≠ Optimal. They reflect entirely different standards. Is good health merely the absence of disease – or the ability to function at your best?
What does ‘normal’ really mean?
Normal ranges are statistical constructs. They represent the middle 95% of values from a reference population. But this population is not a proxy for perfect health. It includes people who may be at risk or asymptomatic. Lab results guide over 70% of clinical decisions – whether for diagnosis, prognosis, or ruling out disease. To define a reference range, labs test 120 or more people within a set demographic. They exclude the lowest and highest 2.5%, leaving a range that reflects what’s “common” – not what’s ideal.
This means:
- Up to 5% of healthy people might be flagged as abnormal.
- People with early stage or silent disease can still fall within the ‘normal’ range.
This is where diagnostic blindness begins—you’re told you’re fine, but biologically, you’re already in the grey zone.

Why optimal > normal
Normal ranges are averages – statistical estimates based on population data. They’re broad enough to include people with pre-existing conditions or undiagnosed dysfunctions. So, even if your value falls within the range, it doesn’t mean your body is functioning at its best. Normal simply means you’re not in crisis. It doesn’t reveal whether you’re ageing well, recovering efficiently, or responding to stress in a healthy way. The ranges vary by age, gender, ethnicity, and baseline health.
Why optimal ranges matter
Optimal ranges are built on outcomes. They map biomarker values that are consistently linked to better health metrics – from metabolic stability and hormonal balance to reduced inflammation and longer healthspans.
These ranges are:
- Tighter and more precise
- Predictive of low disease risk
- Geared for prevention
For instance, a lab test might categorise insulin of 1.9-23 μU/mL as normal. But the FOXO optimal range is 2–5 μU/mL—associated with better glucose control and metabolic efficiency. Beyond that range, dysfunction has lilkely begun. Even without symptoms, the system is veering off course.
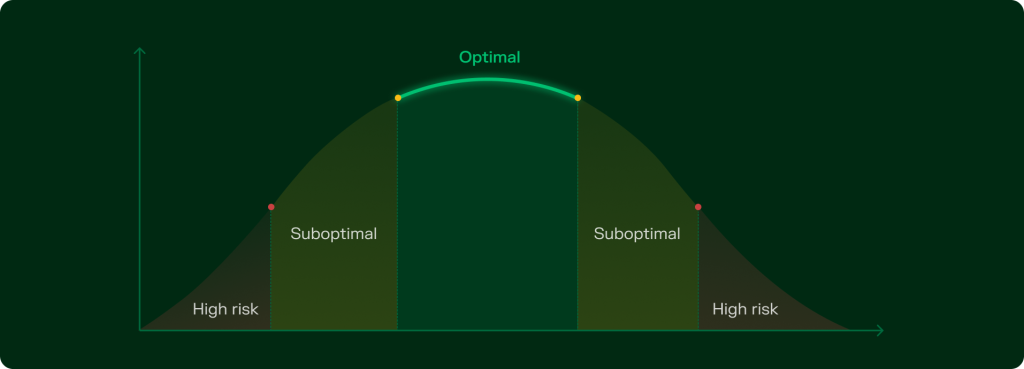
Understanding suboptimal levels
When a biomarker drifts toward the edge of the optimal zone, it enters the suboptimal range – signalling that your body is approaching a functional tipping point.
They’re not cause for alarm, but they are reason to pay attention. Think of them as early alerts in your system. You haven’t crossed into the high risk zone yet – but you’re closer to biological strain than stability.
Suboptimal levels indicate underlying risks or unidentified pathologies.
This is where fine tuned interventions matter. Small shifts in sleep, nutrition, supplementation, or stress can help recalibrate your system – keeping you in the high performance zone.
Why normal isn’t a guarantee
In traditional healthcare, if your values aren’t too high or too low, you’re told you’re fine. But biology doesn’t work in absolutes.
You can sit comfortably within the normal range and still be at risk. Why? Because ‘normal’ includes the full spectrum of health states -including early dysfunction and silent decline.
Here’s the problem:
- A value at the edge of normal isn’t a green light. It could be a yellow flag.
- Lab ranges don’t account for personal risk, environmental stressors, or trajectory.
- Normal is often designed to detect disease – not to optimise health.
The real risk lies in the zone of assumption: where you think you’re fine, but the system is under strain.
‘Normal’ is about surviving. ‘Optimal’ is about thriving.
FOXO score: normal vs optimal
FOXO contextualises the reports., it’s not a linear trajectory. We understand that standard lab ranges are broad and designed primarily to flag extremes. Using India specific biomarker data and functional health benchmarks, we separate what’s merely common from what’s truly optimal.
Here are some common biomarkers that are tested to assess one’s health and their optimal ranges:
Insulin
Secreted by the pancreas, insulin regulates blood glucose levels. Poor regulation can lead to insulin resistance – and eventually, diabetes.
Commonly used range: 1.9 – 23 μU/mL
Optimal range: 2-5 μU/mL
Suboptimal ranges: 1.9 – 2 μU/mL and 5 – 23 μU/mL
High Risk: < 1.9 μU/mL and >23 μU/mL
Hypoinsulinemia (low insulin levels): May result from beta-cell dysfunction, autoimmune damage, or pancreatic surgery. It impairs glucose uptake, leading to energy and metabolic disruption.
Hyperinsulinemia (high insulin levels):
- Without Insulin Resistance: Causes hypoglycemia (reduced blood sugar levels).
- With Insulin Resistance: Does not reduce blood sugar levels and, along with high insulin resistance, can lead to pre-diabetes and diabetes.
LDL (low density lipoproteins)
Often called “bad” cholesterol, LDL carries cholesterol to cells that need repair – but can also deposit it on artery walls. Elevated levels raise the risk of cardiovascular disease.
Commonly used range: < 100 mg/dL
Optimal range: 40 – 80 mg/dL
Sub optimal range: 80 – 100 mg/dL
High risk: >100 mg/dL
LDL deficiency: May result from genetic conditions, malnutrition, or certain medications. It disrupts cholesterol transport, weakens cell membrane structure, and impairs hormone synthesis and fat soluble vitamin absorption.
LDL excess: Commonly caused by poor diet, obesity, or inactivity. High levels lead to cholesterol buildup in arteries, increasing the risk of heart attacks, strokes, and atherosclerosis.
Triglycerides
Triglycerides are energy dense lipids stored in fat tissue. They serve as a major energy reserve but must remain within healthy limits.
Commonly used range: <150 mg/dL
Optimal range: <100 mg/dL
Suboptimal range: 100 – 150 mg/dL
High risk: >150 mg/dL
Triglyceride deficiency: Disrupts energy storage and use – especially during physical activity. Linked to poor nutrient absorption, weight loss, or hormonal imbalance.
High triglyceride levels: Common in obesity, uncontrolled diabetes, and other metabolic dysfunctions. Excess triglycerides accelerate fat buildup in arteries – increases risk of cardiovascular diseases and metabolic syndromes.
Vitamin B12
Vitamin B12 is essential for the development, myelination, and function of the central nervous system. It aids in the formation of healthy red blood cells and DNA synthesis, also acting as a cofactor in various enzymatic reactions.
Commonly used range: 197 – 771 pg/mL
Optimal range: 500 – 900pg/mL
Suboptimal ranges include 300 – 500 pg/mL
High Risk: <300 pg/mL
Vitamin B12 deficiency: Impairs DNA synthesis and red blood cell production, and significantly affects nerve function.
High vitamin B12 levels: Can indicate underlying health conditions that warrant further investigation.
Vitamin D
Vitamin D is crucial for calcium absorption, bone growth, and preventing bone disorders like rickets, osteomalacia, and osteoporosis. It also supports immune, neuromuscular, and cellular functions, reduces inflammation, and regulates gene activity.
Commonly recommended range: 30 – 100 ng/mL
Optimal range: 50 – 80 ng/mL
Suboptimal ranges: 30-50 ng/mL and 80-100ng/mL
High Risk: <30 ng/mL and > 100 ng/mL
Vitamin D deficiency: Affects calcium absorption and bone mineralisation, leading to various bone diseases.
High vitamin D levels: Excess vitamin D increases calcium absorption, potentially leading to high blood calcium levels (hypercalcemia), which can be harmful.
Why should you prioritise optimal range over normal?
If you’ve been assessing your health solely based on the “normal range”, it’s time to shift your perspective to optimal. The optimal range reflects biomarker levels associated with more accurate health outcomes.
Aim for optimal rather, now that you know normal is not really – normal. See what changes you need to make to address these imbalances, mitigate risks and support long term vitality. You catch them early, you add a few more days and eventually years into your lifespan.